Graphing is a key part of Common Core measurement and data standards. Here are 5 free graphing activities that teach filling in a graph and help students learn how to make a graph by seeing various examples. You’ll find a mustache class questionnaire, a monster spinning printable and 3 edible treat graphs.
Have you seen? The Teach Junkie measurement and data section is growing in numbers of pictured tutorials with free lesson plans for how to teach math so you can always search there if you’re looking for something different. {wink}
Fun Graphing Activities
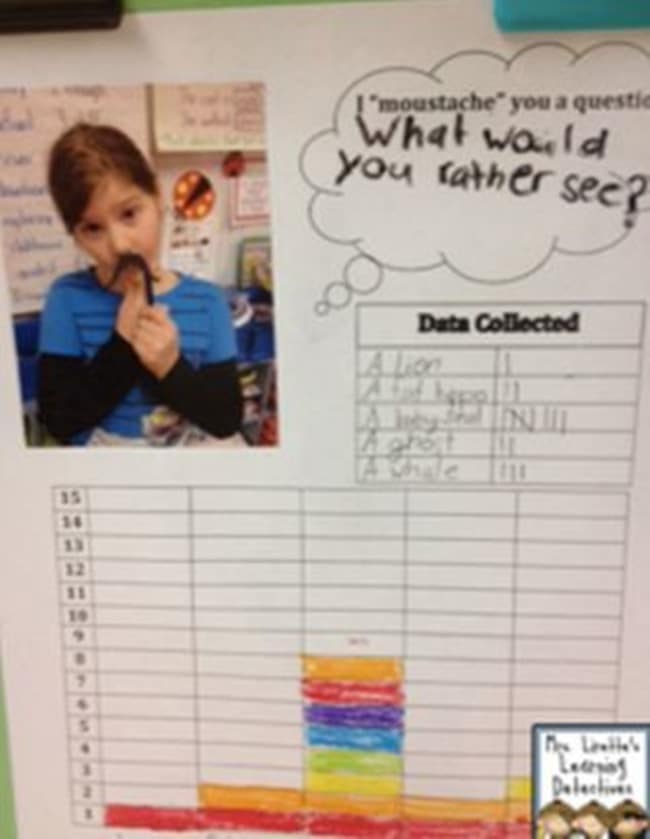
1. Moustache You a Question – Students generate questions to ask their classmates. All while wearing a fantastic mustache that just makes the “mustasche” you a question fad go a long way in the classroom.

2. Spin N Graph Monsters – Work on tracking and recording the number of spins for each monster in this Easter palette spin and graph activity.
Edible Treat Graphs for Measurement and Data

3. Chocolate Easter Bunny – Label the parts of an Easter chocolate bunny and vote on which part they would like to eat first. Graph your class’ results and analyze them.
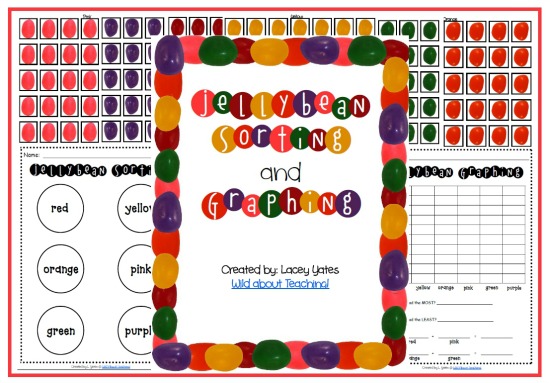
4. Jellybean Sorting and Graphing – Complete with a sorting math and graphing page, you can use real jelly beans or paper cutouts to graph and record.
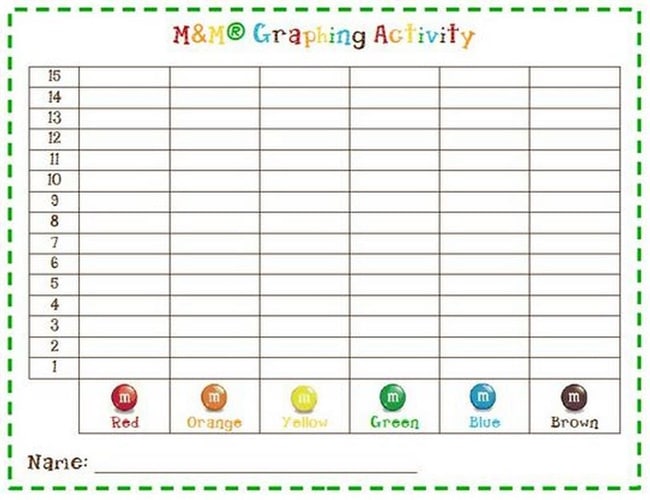
5. M&M Graphing – Get a handle on graphing the colors of the rainbow using a bag of M&M’s. A mini-sized bag is the perfect treat for young students to sort and graph. Turn it up a notch to find the mean, median and mode for more advanced levels of students.
I hope you found these fun measurement and data ideas to be helpful in planning out any lessons for your graphing math needs. Thanks talented teachers – your printables and lessons are great! Feel free to share your “I’m a Featured Teach Junkie” badge on your blog, facebook or instagram. You earned it! {{fist pound}}

Share your teaching idea here on Teach Junkie. We love hearing from teachers, teacher-bloggers and from you! Join the Teach Junkie Community and be a part of this collaborative blog.
P.S. Don’t forget to check out the Teach Junkie Facebook page. It’s a great place to ask questions on how to make things or for specific lesson ideas/collections that you are looking for. I’ll be happy to find them for you!
| SUBMIT YOUR TIP |
More Math Activities
- Primary Games To Make Teaching Standards Easier
- 16 Spring and Easter Math Ideas {Free Download}
- Superhero Hundreds Chart Game {Free Printable}
- 3 Free Math Activities for Area, Perimeter, Volume
Leslie {aka the original Teach Junkie} loves learning new things to make teaching easier and more effective. She enjoys featuring creative classroom fun when she's not designing teacher shirts, making kindergarten lesson plans or planning her family's next trip to Disney World.